
Sequence Performance Benchmarks by Industry and Company Size
Benchmarks by deal size and industry reveal why averages mislead sales sequences.
A single average sequence benchmark hides two very different populations inside one number, and that number ends up telling most teams the wrong thing about their own performance. The distribution underneath any blended benchmark is not symmetric: a small group of top performers is far above the mean, a much larger group is well below it, and the average in between describes neither group with any accuracy. Buying committee size, cycle length, and the reply rate a segment can tolerate all shift depending on company size and industry, and those shifts are large enough to swamp whatever signal a blended number was supposed to carry. A sequence built correctly for an SMB transactional motion will look broken when someone holds it up against an enterprise benchmark, and a well-run enterprise sequence will look sluggish next to SMB numbers it was never designed to match. Judging whether a sequence is underperforming requires knowing, first, which segment's numbers actually apply to it.
Baseline cycle length by company size and deal ACV
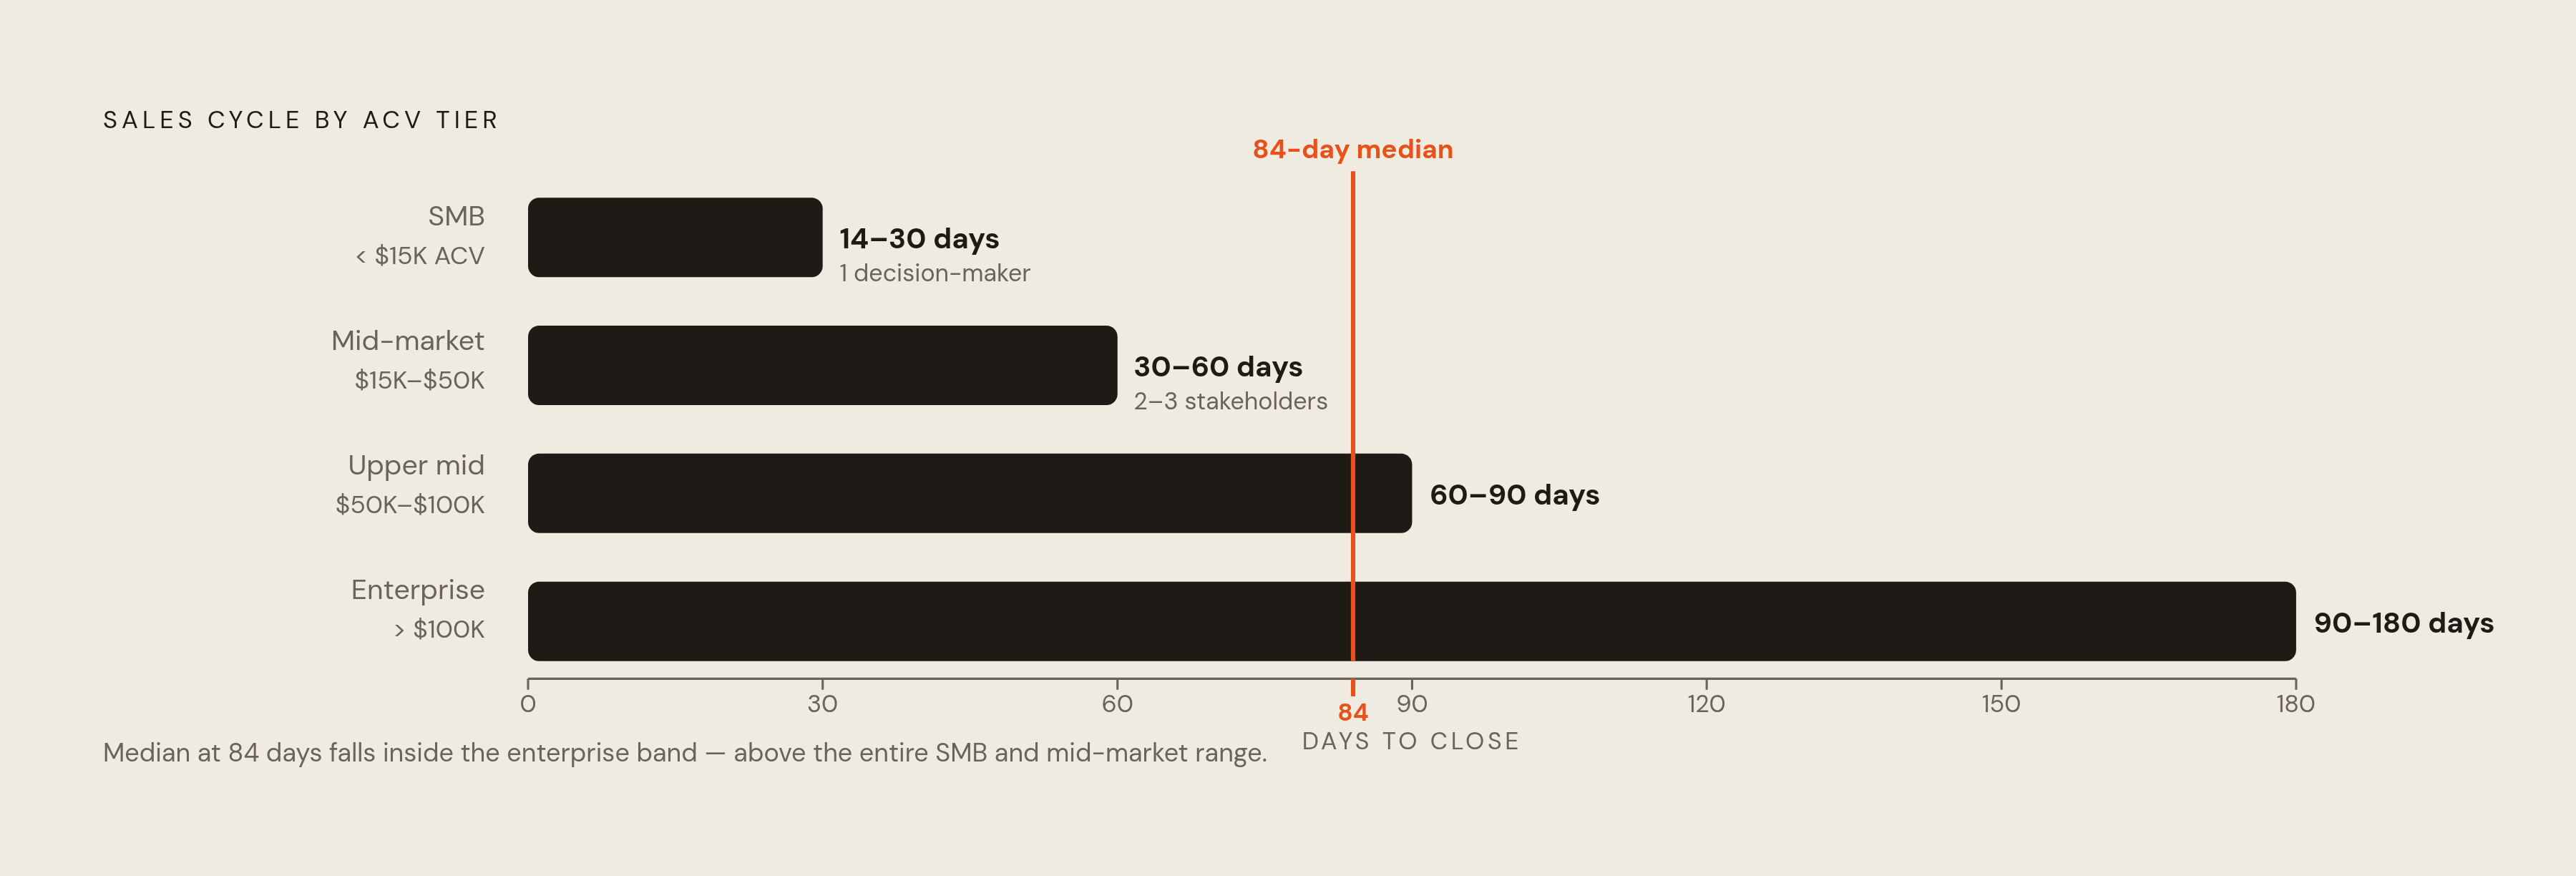
Cycle length scales with deal size in a way that is steep and predictable, so annual contract value is the most reliable starting point for setting sequence depth and timing expectations, well before anyone tunes subject lines or touch cadence. SMB deals under $15,000 ACV close in 14 to 30 days, often with a single decision-maker and sometimes a straight credit card checkout with no committee. Mid-market deals between $15,000 and $50,000 ACV run 30 to 60 days and typically bring procurement into the conversation alongside two or three stakeholders. Upper mid-market deals from $50,000 to $100,000 ACV take 60 to 90 days, a window that reflects security review, legal redlines, and a budget approval cycle layered on top of the sale itself. Enterprise deals above $100,000 ACV run 90 to 180 days or longer, shaped by RFP processes, committee-based decisions, and budgets that span multiple quarters.
ORM Tech's sales cycle guide finds that deal size and committee size explain more of the variance in cycle length than industry label does, making these ACV tiers the right starting point for calibrating a sequence, with industry serving as a refinement layered on top. The median B2B sales cycle across all segments is 84 days, but that figure is close to useless as a planning input once you account for the many-fold spread between the smallest and largest prospect tiers. A sequence built to the 84-day median will run far too long for an SMB deal and far too short for an enterprise one, missing the mark in both directions at once.
Buying committee size and sequence length
Stakeholder count operates as its own variable in sequence design, separate from both industry and deal size, because each additional decision-maker added to a buying committee extends the cycle in a compounding way. ORM Tech describes the mechanism directly: a deal with three stakeholders can move from demo to proposal in two weeks, while the same deal with seven stakeholders can take six weeks to cover that identical step. The slowdown happens because the champion inside the account has to align everyone internally before the deal can move forward, and each stakeholder added to that internal alignment task multiplies the coordination overhead involved.
That compounding effect carries a direct consequence for how a sequence gets built. A sequence aimed at a single contact inside a large enterprise account is addressing the wrong structure entirely, because no amount of cadence optimization toward one inbox substitutes for reaching the other people who actually have to sign off. Multi-threading to several contacts inside the account is a structural requirement of the architecture, not an optional refinement layered on once the basics are working. Salesmotion's 2026 win rate guide notes that enterprise deals typically involve a large number of decision-makers, often reaching into the low teens, so a sequence designed around a single thread is built for a committee size that no longer matches what enterprise buying groups actually look like. The industry-level cycle numbers that follow come from this mechanism: two verticals can carry the same average deal size and still require very different sequence depth, because the committees behind those deals are not the same size.
Sales cycle benchmarks by industry vertical, broken out by pipeline stage
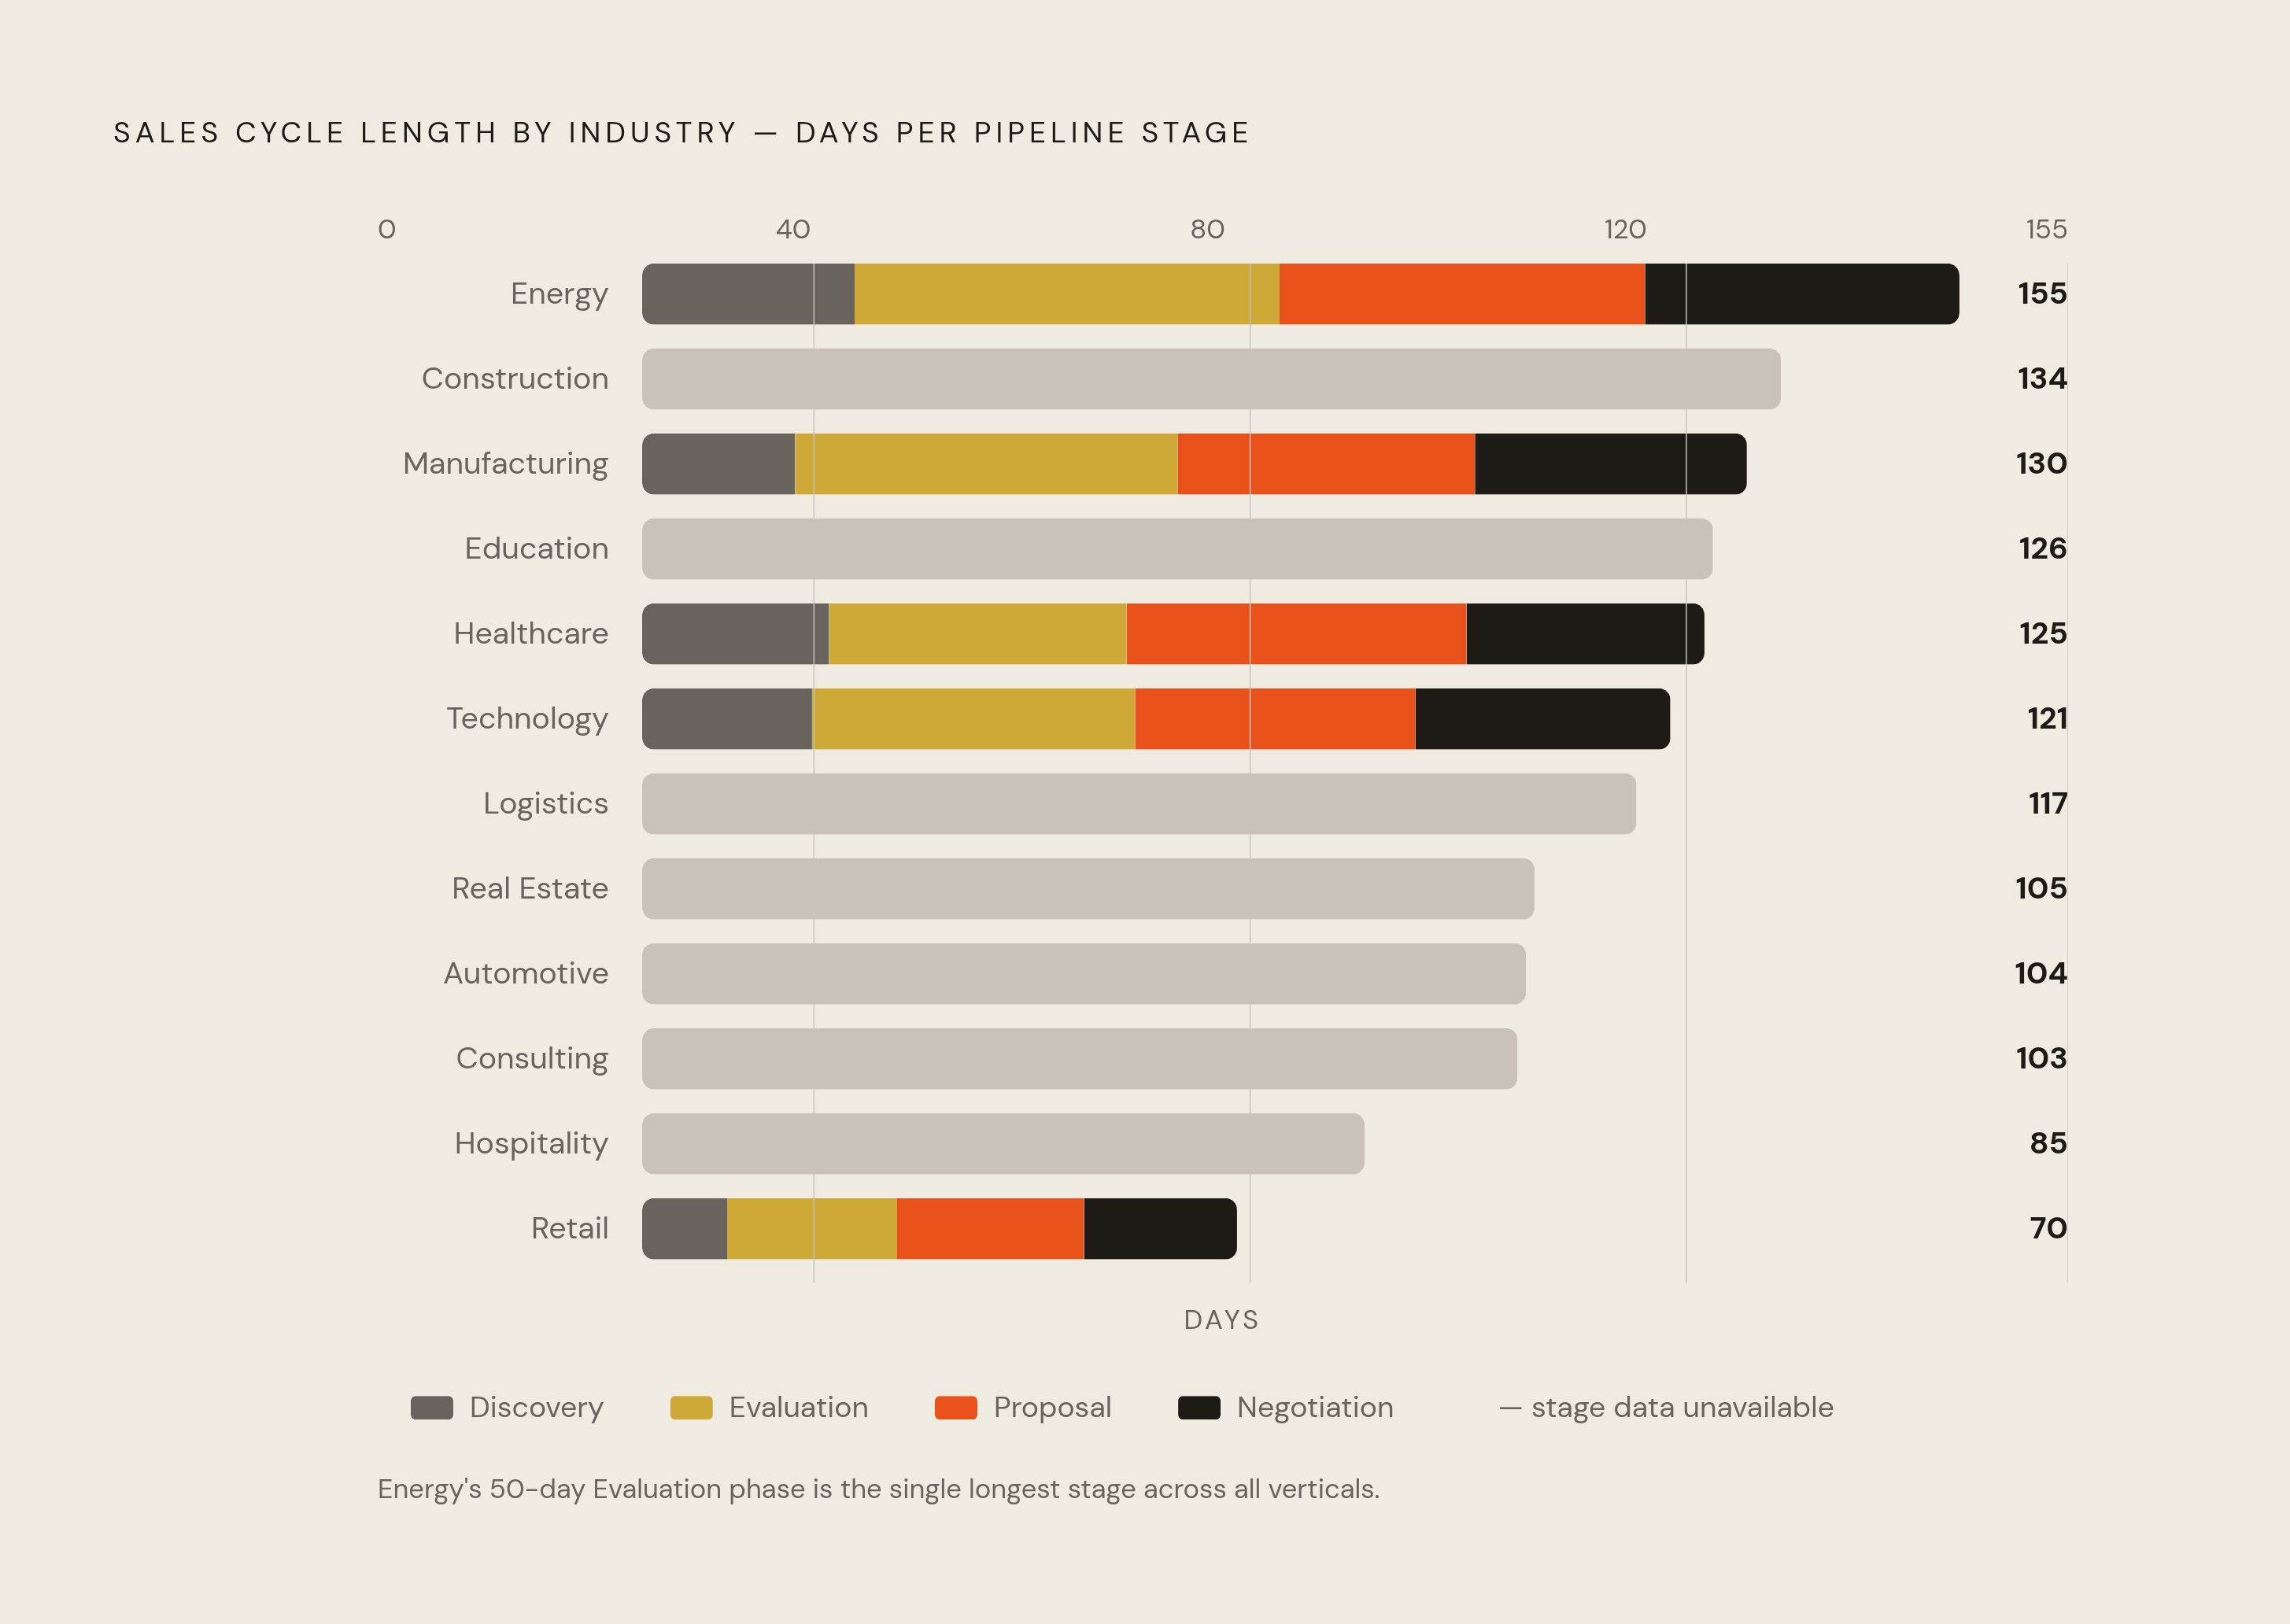
Industry vertical changes more than the total number of days a deal takes to close. It changes where inside the cycle those days get spent, which determines the stage where a sequence has to do its hardest work. The figures below break each vertical into four sequential pipeline stages, followed by the total cycle length in days.
Manufacturing runs 18 / 45 / 35 / 32, totaling 130 days. Healthcare runs 22 / 35 / 40 / 28, totaling 125 days. Retail runs 10 / 20 / 22 / 18, totaling 70 days, the shortest cycle among the verticals measured. Technology runs 20 / 38 / 33 / 30, totaling 121 days. Consulting runs 17 / 33 / 29 / 24, totaling 103 days. Education runs 25 / 40 / 32 / 29, totaling 126 days. Real Estate runs 17 / 34 / 29 / 25, totaling 105 days. Hospitality runs 14 / 27 / 24 / 20, totaling 85 days. Logistics runs 19 / 37 / 33 / 28, totaling 117 days. Energy runs 25 / 50 / 43 / 37, totaling 155 days; that is the longest cycle among the verticals with stage-level detail. Pharmaceuticals carries a cycle almost as long as Energy's, driven by the same kind of regulatory review layers. Automotive runs 16 / 33 / 28 / 27, totaling 104 days. Construction runs 22 / 43 / 37 / 32, totaling 134 days. Media & Entertainment is a moderately long cycle, comparable to several other mid-tier verticals in the set.
One pattern recurs across most of these industries: Evaluation or Proposal is the longest single phase in the cycle, though Negotiation exceeds it in Healthcare, Financial Services, and Retail, consuming a substantial share of total cycle time in those verticals. Sequences that go quiet after the first meeting are missing the window where deals are most actively being shaped, since that window falls well past the initial outreach and discovery stages in nearly every vertical measured here. Non-profit organizations carry the longest average cycle of any segment in this data, a result of committee-based approvals layered on top of budget constraints tied to fiscal and grant cycles. Energy and Pharmaceuticals are at the long end of the regulated verticals for a related but distinct reason: compliance and procurement review layers land in the second half of the deal in both industries. ORM Tech identifies this as a structural feature of regulated sectors generally, not a quirk particular to either vertical's culture or buying style.
Win rate benchmarks by vertical
Cycle length tells you how long a deal should take to move through the pipeline, but it says nothing about whether the sequence driving that deal is actually converting. Win rate is the metric that answers that question, and it is segmented by vertical in much the same way cycle length is. The single blended benchmark problem from the opening section shows up again here in a different form.
Salesmotion's 2026 win rate guide finds that win rates fall in a predictable pattern as deal complexity rises, and that the right benchmark for any given team depends on its segment, its average deal size, and its sales motion. A high win rate is not automatically good news: it can signal that reps are avoiding stretch opportunities and chasing only the deals most likely to close, leaving harder but more valuable revenue on the table. Comparing a high win rate in a transactional SMB motion against a much lower win rate in a complex enterprise motion tells you nothing about which team is performing better, since the two numbers were never measuring the same kind of deal.
Measurement inconsistency compounds the problem. Salesmotion identifies five distinct win rate calculation methods in use across the industry, each one answering a slightly different question about what counts as a win and what counts in the denominator. Teams that switch formulas between quarters make their own trend analysis meaningless, since a modest rise in the reported rate carries no information if the underlying formula changed between the two periods. Cross-company comparisons run into the same failure when the companies involved mix methods without disclosing which one they used.
The clearest source of discrepancy among published win rate benchmarks is how a team treats deals that never reach a verdict. Whether stalled, no-decision deals count as losses or get excluded from the calculation entirely drives most of the variation across the benchmarks published industry-wide. Teams that exclude no-decisions from their denominator report structurally higher win rates than teams that count every stalled deal as a loss, and the two groups are not measuring the same thing even when they report what looks like a comparable number. A team using a blended, unsegmented win rate benchmark to judge its own conversion is making the identical mistake flagged at the start of this piece: treating a number built from mismatched populations as though it describes any one team's actual performance. Quota attainment by segment adds the third dimension you need to complete that picture, since it shows whether the deals a sequence generates ever translate into a rep actually hitting their number.
Quota attainment by segment and why it is the metric most likely to be misread
Quota attainment looks like the simplest of the three metrics covered here, a straightforward percentage of target reached, and that apparent simplicity is what makes it the easiest one to misread. 2026 benchmarks report found that top-quartile teams still push into 60 to 75% attainment, while bottom-quartile organizations are at 20 to 35%, and that this gap has widened every year since 2022. A single company-wide attainment percentage flattens that spread into one number that describes neither the top quartile's performance nor the bottom quartile's reality.
So the widening gap matters for how a sales organization reads its own sequence data. A team at a middling attainment level is not necessarily running a mediocre, average sequence operation. It may be a bottom-quartile organization that has started to close the distance toward the middle, or it may be a top-quartile organization in a segment where that same level represents a meaningful decline from where it used to stand. Attainment, like cycle length and win rate before it, only becomes diagnostic once it is read against the specific segment, deal size, and vertical it came from, rather than against a single industry-wide figure that was never built to represent any one team's actual pipeline.