
Pipeline Coverage Ratio Benchmarks by Sales Segment
Actual win rates have fallen to 21%, making the standard 3x coverage ratio dangerously low.
Pipeline coverage ratio benchmarks vary by segment, and the standard 3x rule most sales organizations lean on fits almost none precisely, missing high on some and dangerously low on others. This piece lays out what the ratio measures, why the 3x assumption has aged badly, and what SMB, mid-market, and enterprise teams should target instead.
Why the 3x rule exists
Pipeline coverage is total qualified pipeline value divided by the revenue target for the same period. Nothing exotic sits behind it. The number that gets treated as gospel, 3x, comes from inverting a win rate. A team closing 33% of opportunities needs three dollars of pipeline per dollar of quota, since one in three is expected to convert. Experienced sales leaders often add a buffer beyond this mathematical minimum to account for deal slippage, competitive losses, and quarter-end push-outs. A 25% win rate calls for 4x coverage, and a 20% win rate calls for 5x, when the math is run the other direction. The ratio is a direct function of conversionc3.
That means the 3x rule is only ever as good as the 33% assumption baked into it. When a team's real win rate matches that number, the rule works fine. The trouble starts when organizations adopt 3x by default without checking whether their own conversion rate is near a third. Most don't check. The rule gets copied from a slide deck, prior employer, or old handbook, and outlasts the buying environment that produced it. It dates to 1990s B2B selling, with shorter buying committees and fewer stakeholders signing off, conditions that no longer describe most complex sales. Dave Kellogg, a primary reference on this topic, has noted he heard sales managers speak of the rule of three years before ever seeing a salesforce automation system, suggesting the rule may predate the 1990s with no confirmed origin date.
Falling win rates and the increasingly wrong 3x assumption
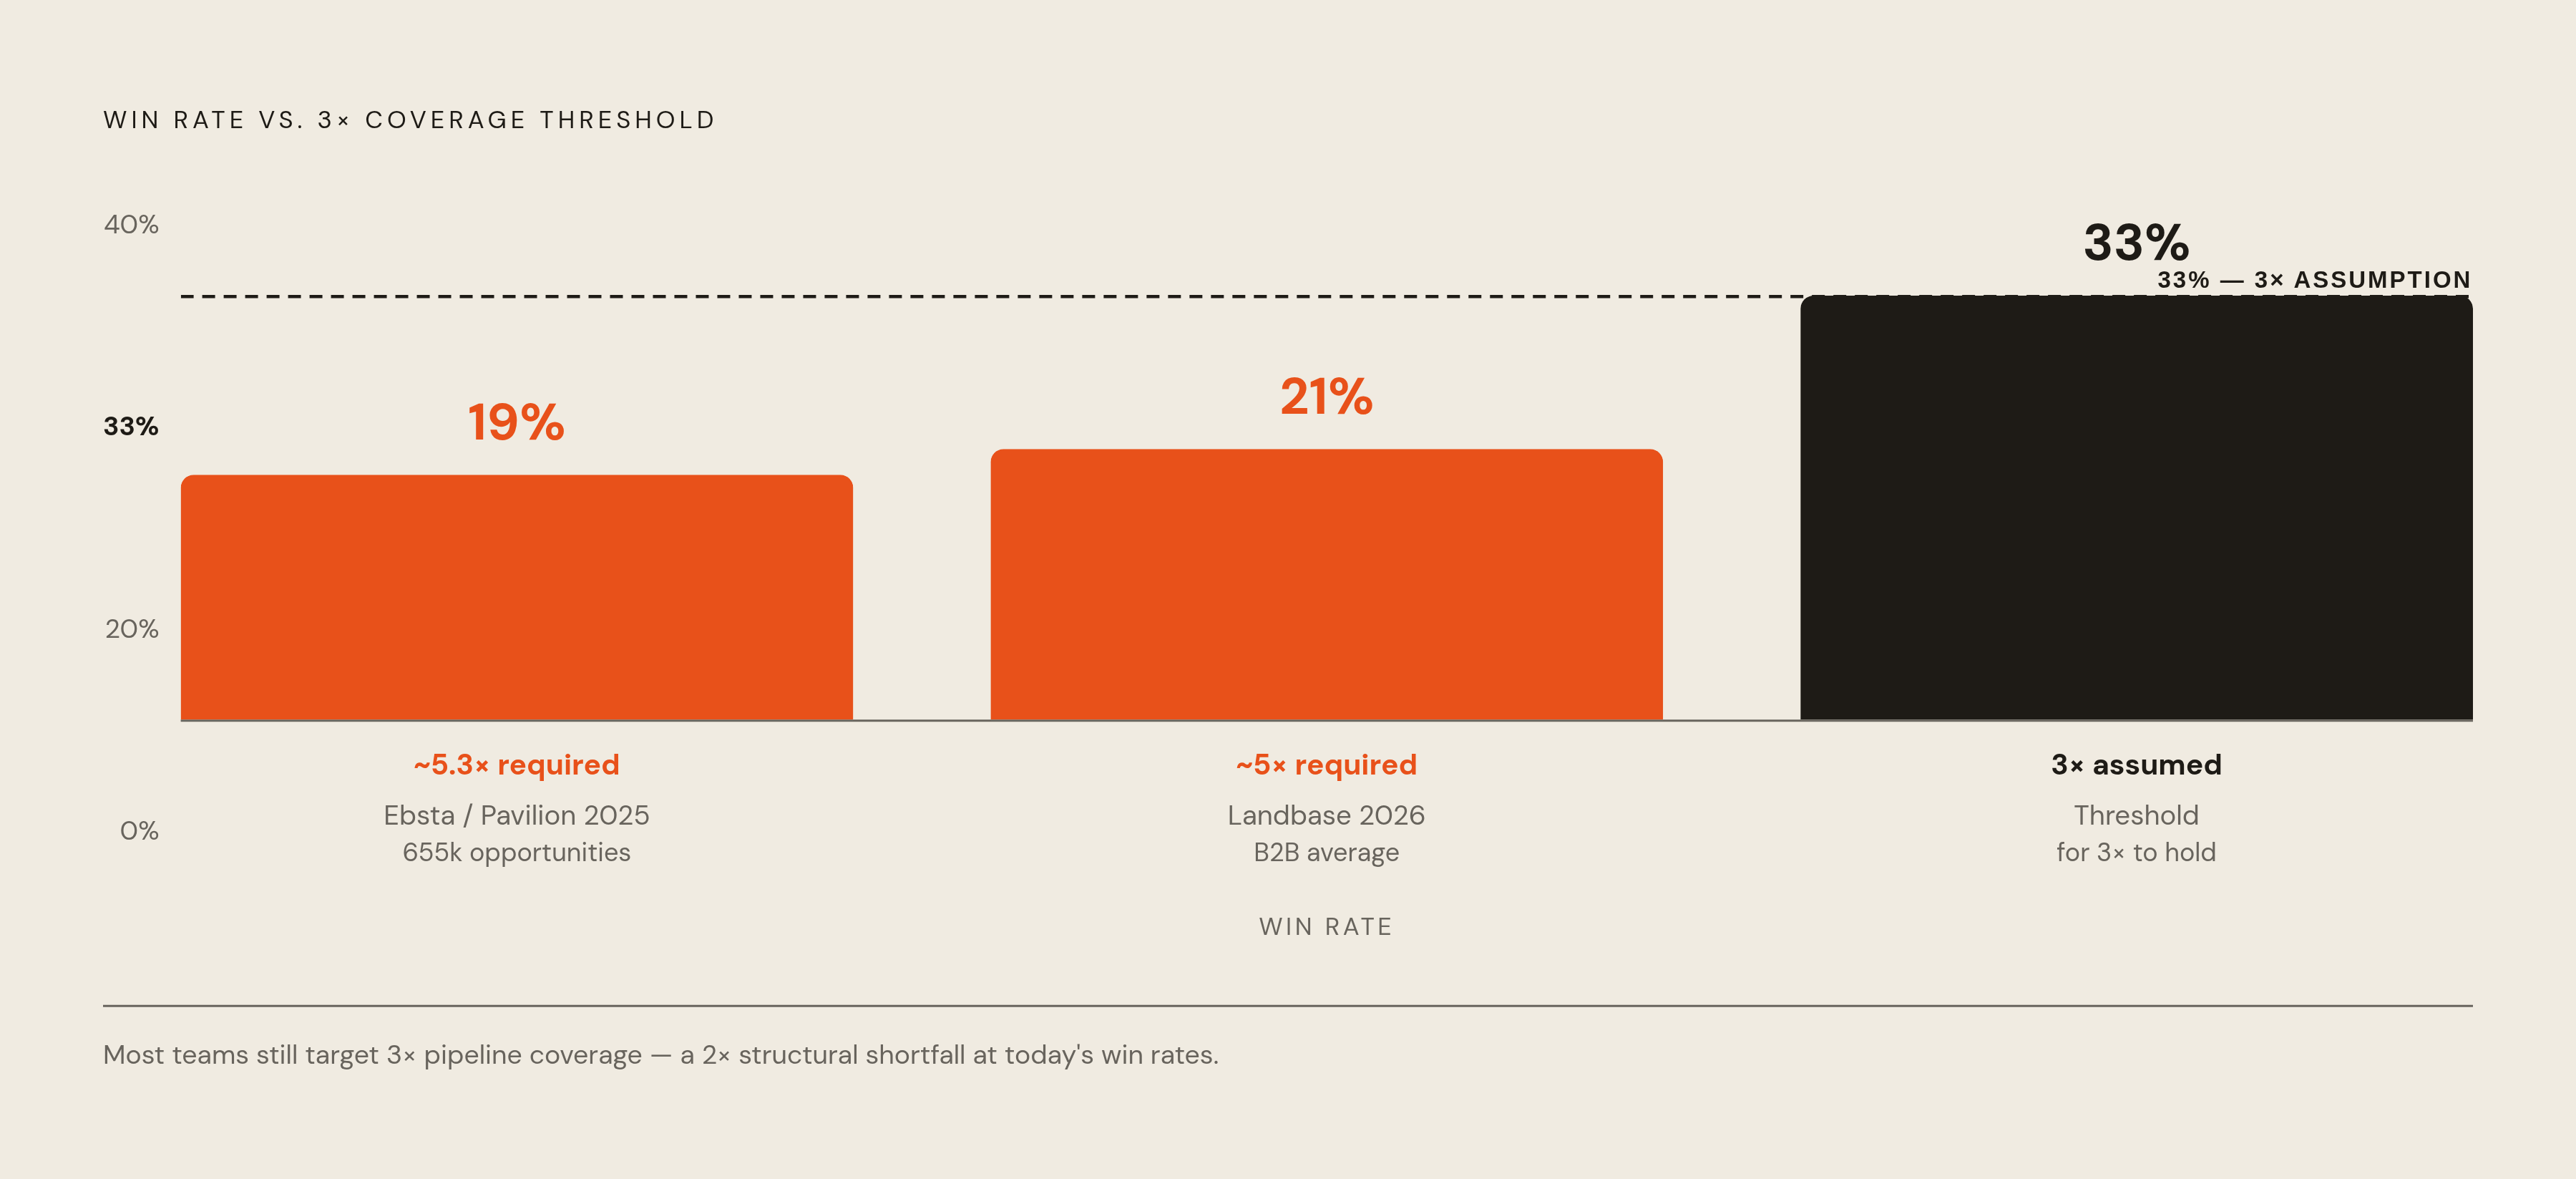
Win rates have been falling, and not by a little. The Ebsta and Pavilion 2025 GTM Benchmarks study, using 655,000 opportunities, found average win rates dropped to 19%, down from 29% the year before. That double-digit single-year decline should force a recalculation of every coverage target built on the old assumption. Separate 2026 Landbase benchmarking puts average B2B win rate at 21% overall and 29% among qualified opportunities. Both sit well below the 33% that makes 3x work, since 1 ÷ 0.33 ≈ 3. Coverage itself functions as a leading indicator, telling a sales leader whether the quarter is statistically winnable under current assumptions, unlike closed-won revenue, which only reports what already happened.
At a 21% win rate, required coverage comes out closer to 5x. A team holding 3x under those conditions is structurally short before the quarter even starts.
Sales cycles have also stretched, up 22% since 2022 per Digital Bloom's research. Longer cycles give deals more time to slip a quarter, stall on delayed approval, or die after a champion leaves. That means coverage requirements climb even for a team whose win rate hasn't moved at all. Falling conversion and lengthening cycles together have widened the gap between 3x and what teams actually need.
This isn't just that 3x is too low on average, since "average" is the wrong frame, given that variance across segments is large enough that one number misleads everyone.
The variables that make each segment's coverage requirement genuinely different
Three structural forces drive how much coverage a segment actually needs. Win rate is the most direct: it's the number you invert to get the mathematical floor, and every point of decline pushes the floor higher. Sales cycle length matters separately, since longer cycles give deals more chance to stall, slip, or vanish, and coverage must absorb that volatility. Deal size variability is the third, and it's the one people underestimate most. A large deal falling out can swing quarterly results dramatically, so segments dominated by big-ticket deals need more cushion than those with many smaller deals spreading risk.
Pipeline quality is the cause beneath all three, degrading each of them, as shown by the data below. Fullcast's Benchmarks Report found high-ICP accounts make up only 23% of total pipeline at many organizations. The remaining 77% converts at lower rates than the CRM's blended average suggests, so the dashboard win rate is often flattering versus reality.
Put together, the right way to think about coverage is as a calculation rather than a fixed multiple. Coverage target equals one divided by the real win rate, multiplied by a buffer for cycle length and deal volatility. The base of that equation, the 1 ÷ win rate part, is fairly mechanical. The buffer is where segments diverge, and this piece works through it in detail.
SMB coverage targets: why high-velocity motions need less cushion, not more
SMB motions compress the required ratio because deal size variability favors SMB: many small deals diversify risk, unlike large deals that create lumpiness in enterprise pipelines. Cycles are short, often days or weeks, leaving little runway for a deal to slip quarters. Win rates run meaningfully higher than what enterprise teams typically post. Because SMB pipelines have many smaller deals rather than a few large ones, losing one barely moves the needle. Diversification is doing real work here.
The numbers reflect that. Landbase's data puts high-velocity SMB motions (~30-day cycles) at 1.7x to 2.5x. Broader SMB benchmarks from monday.com (July 2026) and Saber are 2x to 3x. None approach 3x as a floor, let alone the 4x-5x an enterprise motion with falling win rates might require.
That has a real cost when ignored. An SMB team with strong conversion carrying 3x or higher generates unneeded pipeline, tying up capacity better spent on qualified opportunities or expansion work. Over-coverage isn't free just because it feels safe.
None of this means SMB teams get to ignore the floor entirely. Optifai's research still flags coverage below 2x as a quota-risk signal regardless of segment. SMB velocity buys headroom, not immunity. Because SMB cycles are short, a healthy coverage ratio can erode quickly mid-quarter, so tracking coverage weekly rather than relying on a single snapshot is necessary to catch that erosion.
Mid-market coverage targets: the segment where the 3x rule comes closest to fitting
Cycles here run months rather than weeks, long enough for real slippage but rarely spanning multiple quarters. Win rates are between SMB and enterprise, and the math is closer to 3x than either adjacent segment.
Optifai's 939-company dataset places mid-market coverage at 3x to 4x. Landbase (April 2026) and Fairview (May 2026) are both in the 2.5x-4x range depending on win rate.
The range still needs calibration, though, and it isn't a single number to memorize. A team at the low end of its win-rate band should push toward 4x; strong, consistent conversion allows running at 3x. Mid-market is also where poor fit to the ideal customer profile bites hardest. Fullcast's finding that only 23% of pipeline is high-fit hits hard here, since a few misqualified mid-market deals can distort the aggregate coverage number unnoticed until quarter-close. Per Outreach, 2.5–4x is the operative range. Outreach's own wording sets the lower bound at 2.5x rather than 3x, pairing it with a 2–3x range for high-velocity SMB sales, and the page carries a November 2025 update date rather than July 2026.
Enterprise coverage targets: why 3x is a structural guarantee of missed quota
In enterprise settings, win rates commonly fall in the 15%-25% band, requiring 4x at the high end and nearly 7x at the low end. Cycles stretch six months to a year or more, exposing multiple quarters to budget freezes, champion turnover, and late competitive losses. Enterprise deal sizes concentrate risk: losing one large opportunity can hit a meaningful chunk of quota, with no diversification cushion like SMB has.
The published ranges cluster tightly around this reality. monday.com and SalesHive both cite 4x to 6x. Clari's research puts enterprise teams with win rates between 15% and 25% at 4x to 7x. Optifai's benchmark is 4x to 5x. Saber notes that enterprise motions with the longest cycles tend to be toward the upper end of the 4x to 6x range.
Landbase's framing: an enterprise team at a 15% win rate accepting 3x coverage will miss quota every quarter (the math isn't up for interpretation). Clari Labs' research found 87% of enterprises missed revenue targets in 2025, a gap too large and consistent to be accidental. Clari's official press release, dated January 14, 2026, attributes that 87% miss rate to enterprises despite record levels of AI investment.
Strategic and mega-deal motions push the requirement further still. Cycles of six months or longer with win rates in the low teens push coverage targets well past the standard enterprise range, requiring pipeline building that starts years in advance rather than quarterly.
Segment benchmarks in one place: the reference table
| Segment | Approximate Cycle Length | Win Rate Range | Coverage Target | |---|---|---|---| | High-velocity SMB | ~30 days | high (roughly 50%+) | ~1.7–2.5x | | SMB | under 60 days | moderate-high | 2–3x | | Mid-Market | months (not quarters) | 25–40% | 3–4x | | Enterprise | six months to a year | 15–25% | 4–7x | | Strategic / Mega-Deal | six months or more | low teens | well above standard enterprise range | | New Territories | varies | not yet established | higher than comparable established segment |
Every figure in that table assumes qualified pipeline. Pipeline padded with unqualified leads or dead deals makes any of these ratios meaningless. Optifai's threshold framing: below 2x, quota risk appears regardless of segment; above 6x usually means qualification standards have broken down, not that the team is well-covered.
The table answers what to target. It doesn't answer whether the number a team is looking at right now can be trusted, which is a separate problem.
When to use unweighted versus weighted coverage
Unweighted coverage adds up every open deal at full face value. A deal at first discovery call counts the same as one in final contract redlines. That gives a directional read on volume but says nothing about likelihood of closing. Weighted coverage fixes this by multiplying each deal's value by its stage-based probability before summing. Outreach's example: a $100,000 proposal-stage deal, typically 50% close probability, contributes only $50,000 to weighted pipeline. That $50,000 difference is hidden risk a face-value number doesn't show. Ignoring revenue timing compounds the problem: a $1M pipeline against a $300K quarterly target can look fine at 3.3x, but if 80% of those deals carry a six-month cycle, none of that pipeline will actually cover the current quarter.
It would be a mistake, though, to apply both corrections at once. ORM Tech's research flags this double-counting trap: the benchmarks themselves (3x, 4x, 5x) already assume much of pipeline won't close. Layering stage-based probabilities on top counts the same risk twice; the coverage ratio should run on unweighted pipeline.
The practical answer is to track both numbers, but for different questions. Unweighted coverage answers whether there are enough at-bats at all, which is what the benchmark ratios test. Weighted coverage answers a forecast-quality question: whether those at-bats are likely to produce revenue. The gap between the two is informative: a wide gap means pipeline is loaded with unproven early-stage deals.
One more adjustment matters before any ratio gets calculated: timing. A deal closing two quarters out does nothing for this quarter's coverage regardless of size, so pipeline must be segmented by expected close date before running any ratio. Landbase's 2026 research backs up why this discipline pays off. Teams using genuinely qualified, time-banded pipeline forecast close to reality; teams using inflated, unqualified pipeline miss consistently.
Setting a coverage target when your segment doesn't fit a clean category
Not every motion maps cleanly onto SMB, mid-market, or enterprise. Validating against Optifai's thresholds (below 2x is quota risk regardless of segment, above 6x suggests collapsed qualification standards) helps reach a defensible number.
Start with the real win rate, the actual historical figure, rather than the number the CRM defaults to at each pipeline stage. Pull historical closed-won divided by qualified opportunities entered, by segment, over the last four to six quarters. That gives the mathematical floor, one divided by win rate, which serves as a starting point for the actual target.
From there, add a buffer for cycle length and deal volatility. Longer cycles and heavier deal concentration call for a larger buffer above the floor, within the segment ranges laid out earlier. Then adjust for pipeline quality. If ICP-fit deals make up only a fraction of pipeline (Fullcast's 23% figure), the effective win rate runs well below the stated rate, and the target should reflect that blended reality.
Finally, check the result against the Optifai thresholds: below 2x is quota-risk territory no matter the segment, and above 6x usually means qualification standards have slipped to the point where the coverage number stops meaning anything. For a new territory without a reliable win rate, borrow a higher-end estimate from the closest comparable segment and recalibrate after two full cycles close. The number a team lands on this way won't be perfectly precise, but it will be honest, which is the entire point of running a coverage ratio.
Sources
- Guide to Pipeline Coverage Ratios That Actually Drive Growth - Fullcast
- Sales Pipeline Coverage Ratio Guide
- What is sales pipeline coverage? Formula, examples, and ideal ratios
- Sales Pipeline Coverage Ratio: Formula, Benchmarks & Examples
- Sales Pipeline Coverage - Definition & B2B Examples | SalesHive
- Pipeline Coverage Ratio: What Your Number Actually Means | Clari
- Pipeline Coverage Ratio: Targets and How to Improve — Fairview
- How do you calculate sales pipeline coverage ratio? - Optifai Data & Insights | Optifai