Sales Forecasting Formula Construction for Revenue Teams
Even the right forecasting formula fails on stale data.

- Written by
- Marcus Thibodeaux
- Published
- November 20, 2026
- Reading time
- 8 min read
What this covers
Sales forecasting formula construction is a problem of both structure and evidence. Revenue teams need a formula that fits their sales motion, accounts for timing and buyer risk, and draws on complete, current data. A sound equation cannot fix stale inputs, and clean data cannot fix a formula that measures the wrong thing.
Why the core forecasting formula fails before the data quality problem is even addressed
The common calculation of pipeline multiplied by win rate treats deals at the same stage as equally likely to close. They are not equivalent. Buyer behavior and deal health can differ sharply within a stage, even when every CRM field is accurate. A stage probability describes a historical group, while a forecast must estimate the outcomes of specific deals in a specific period.
Apollo’s 2026 guide identifies this assumption as the model’s “critical blind spot” and separately notes that static win rates cannot adjust for seasonality, rep tenure changes, or product launches. The guide says that fewer than a fifth of sales teams get strong forecast accuracy from static formulas alone. Fixing the inputs alone will not correct a formula that substitutes a historical category for live deal health.
The four formula variants and what each one actually measures
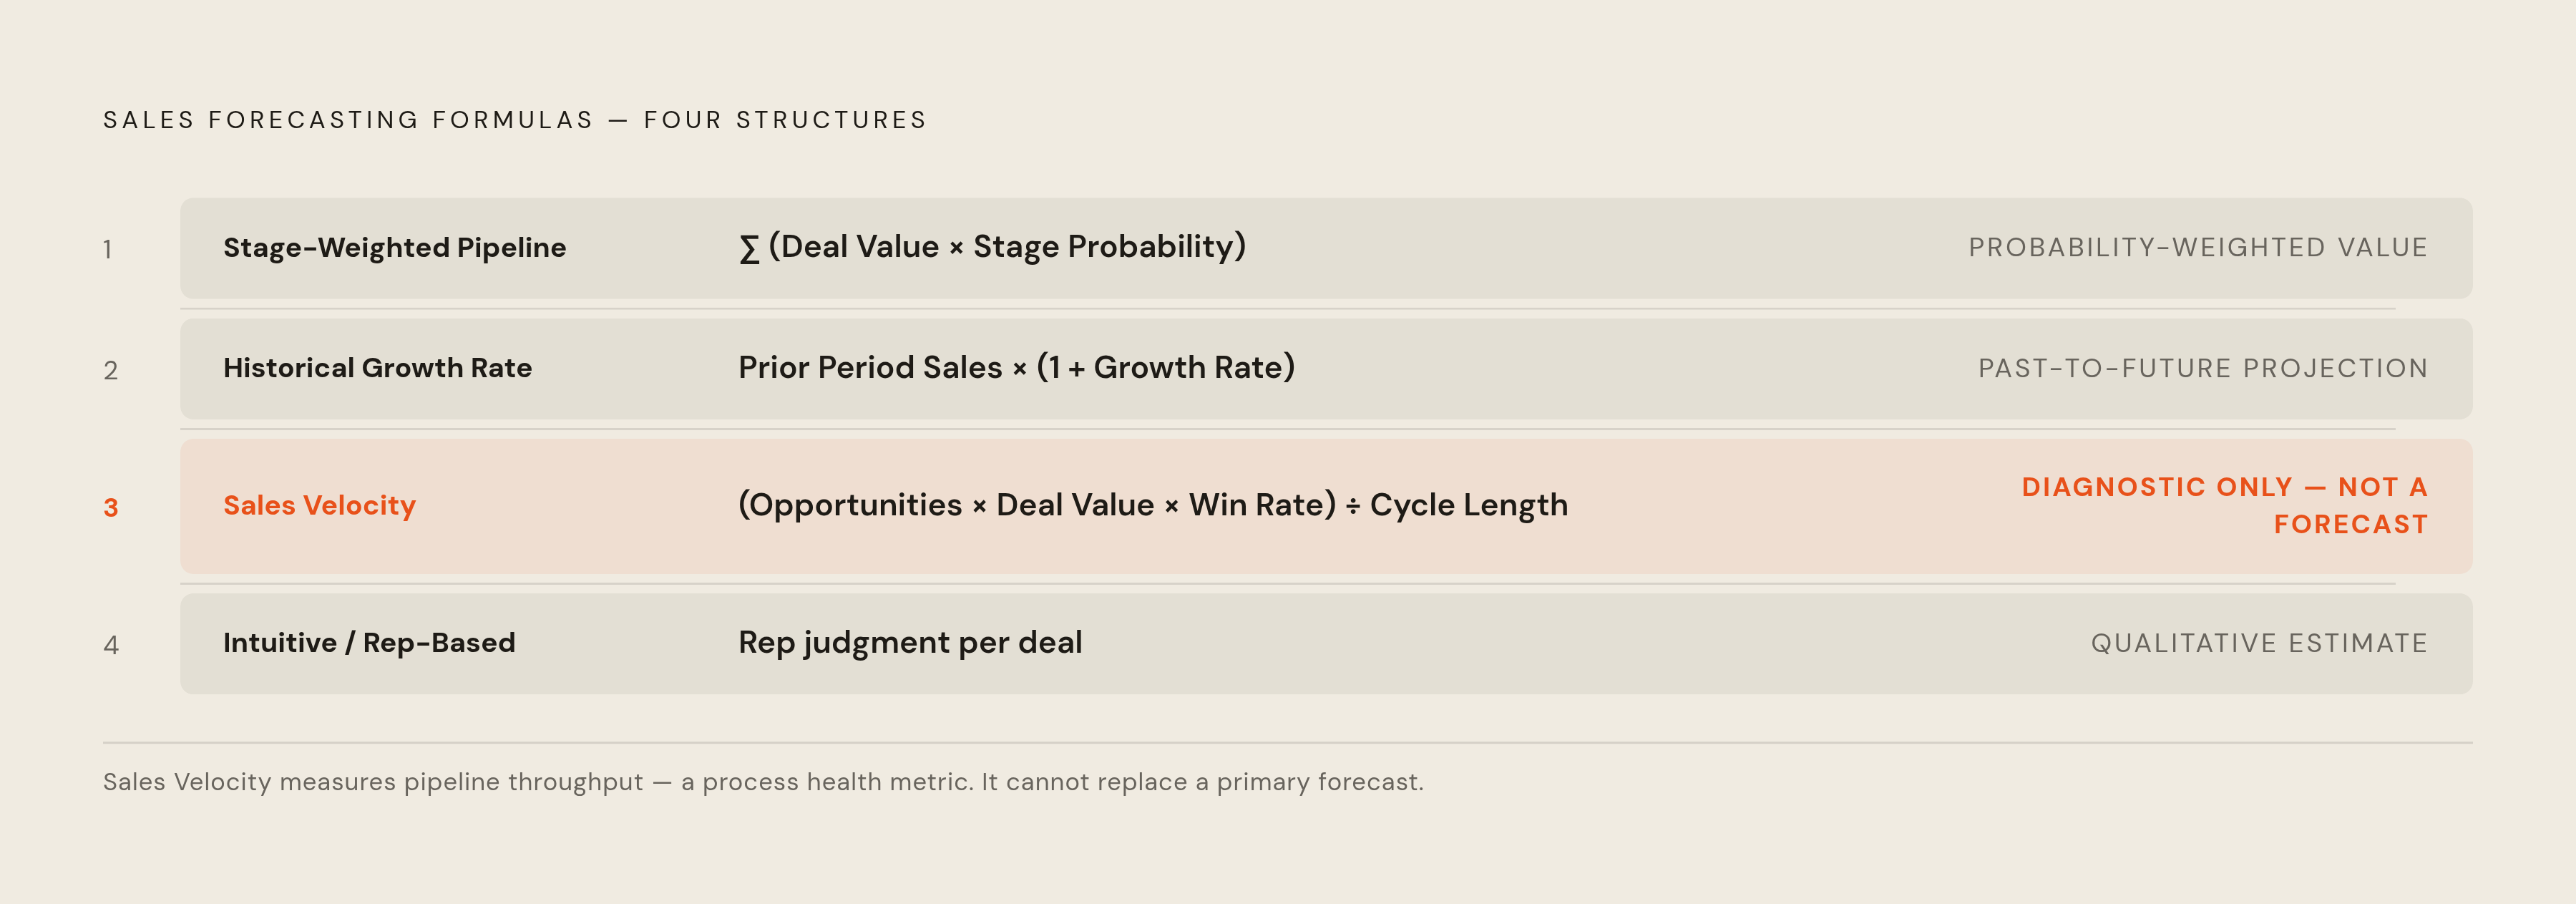
The formula for Stage-Weighted Pipeline is Forecast = Sum of (Deal Value × Stage Probability) for all deals. Sybill’s 2026 methods guide offers this structure for teams that have defined their pipeline stages and have historical CRM win rates. Its output is probability-weighted pipeline value. It fits a B2B motion in which stages have consistent meanings, but breaks down when reps apply those definitions differently. The calculation then assigns the same probability to deals that have not reached the same level of progress.
The formula for Historical Growth Rate is Sales Forecast = Previous Period Sales × (1 + Growth Rate). NetHunt’s 2026 guide positions it for stable, high-volume businesses with dependable historical data. This is a projection from past sales. It fits a business whose previous period provides a useful basis for the next, but breaks down in high-growth or high-churn environments where that relationship no longer holds. Accurate historical records do not make an unsuitable growth assumption reliable.
The formula for Sales Velocity is Velocity = (Opportunities × Deal Value × Win Rate) ÷ Cycle Length. Apollo presents it as a measure of how quickly revenue moves through the pipeline. Its role is diagnostic. It is most useful alongside a primary forecast and breaks down as a substitute for one because throughput does not establish which opportunities will close within the reporting window.
Intuitive, or rep-based, forecasting uses rep estimates rather than a fixed arithmetic equation in the supplied methods. Sybill describes how to use those estimates with conversation intelligence to reduce rep-optimism bias. Its input is judgment about individual deals. It fits a mix of methods that draws on what reps know, but becomes less reliable when reps think buyers are more committed than they have said. These four structures therefore provide different starting points.
Two variables most teams leave out of their chosen formula
A chosen formula can still understate risk if it omits deal slippage. A deal may close eventually without closing in the forecast period. Timing changes the revenue estimate, even when the deal’s value and ultimate win probability stay the same. Weflow’s 2026 guide describes close-date slippage as “the silent killer of forecast accuracy” because movement from one period to the next cascades through the quarterly forecast. A slippage discount makes that timing risk explicit rather than leaving it buried inside a general probability.
Apollo recommends applying slippage discounts by territory, product line, or deal size. Buyer indecision requires a separate adjustment. A deal can look healthy on stage and engagement measures while the buyer remains unready to decide. The guide identifies deal age relative to average cycle length and the number of stakeholders engaged as proxies for this risk. An indecision coefficient represents that distinction without assuming that visible activity proves readiness.
Both adjustments belong to formula construction. A correctly recorded close date does not itself account for the chance that the date will move, just as an accurate stage label does not measure decision readiness. Adjustments for each segment keep those differences in the calculation. They also provide finance with a more defensible explanation of why apparently similar pipeline values yield different forecasts.
Pipeline coverage as the first sanity check on whether the formula's output is plausible
Pipeline coverage provides a quick check on whether a forecast is plausible. Apollo defines the ratio as total pipeline value divided by quota, so pipeline worth three times quota is 3× coverage. This is a validation measure. It tests the amount of pipeline available against the target, but a standard benchmark cannot establish adequacy for every business. Its meaning depends on the opportunities represented by the total.
Quantity and quality diverge when that pipeline includes stalled or low-probability deals. What looks like 3× coverage may give much less effective coverage once those opportunities are discounted. ZoomInfo’s forecasting guide places coverage metrics in the forecast document with confidence intervals and deal-level assumptions. Those assumptions make the ratio interpretable. Coverage is therefore the point where formula design meets input quality, because a correctly constructed forecast can still draw from pipeline that is too thin or too stale to support its result.
Why CRM data quality degrades the formula regardless of which variant a team uses
Manual CRM entry creates a lag between what happens in a deal and what appears in the forecast. The calculation can only use the recorded state. When that state trails buyer activity, even a sound formula estimates revenue from an outdated account of the pipeline. This makes data completeness and accuracy the dominant practical failure mode after the structure has been chosen. The equation may run correctly while its evidence is wrong.
Stale close dates are one direct expression of that lag. A date that a rep has not updated can place revenue in the near term even though the deal’s timing has changed. Inconsistent stage definitions create a different distortion. NetHunt explains that when reps use stage labels differently, stage probabilities average unlike deals and invalidate the weighted calculation. The first failure misstates timing, while the second undermines the meaning of the probability itself.
A third way forecasts fail is when some activity goes unrecorded. A forecast cannot reflect relevant activity that never reaches its inputs, regardless of how carefully the existing fields are maintained. The activity-capture case described by Apollo illustrates this distinction. Forecast variance fell after data capture was fixed, changing the evidence available to the model.
Stage weighting depends directly on consistent stages, velocity depends on credible pipeline measures, and rep judgment can remain detached from recorded buyer evidence. Historical growth has a different exposure because it relies on dependable past sales. The common requirement is trustworthy data for the quantity each method estimates. Changing the formula does not, by itself, repair missing or misleading records.
A variable the formula cannot capture from CRM fields alone — execution quality on individual calls
A deal’s close probability can change between stages because of what happens in a buyer conversation. A stage label does not capture that change. Buyer sentiment, engagement patterns, competitive risk, and objections show things about deal health that the pipeline’s categorical fields do not.
Conversation intelligence addresses that gap by capturing what buyers actually said, including objections, hesitations, and commitment signals. Sybill describes using this evidence with intuitive estimates to bring what reps think closer to what is true for the buyer. The distinction is consequential for rep-based forecasting. A rep’s confidence is an estimate, and the concerns a buyer has voiced give teams evidence to check it against. This adds a signal that stage probability alone cannot supply.
Apollo’s activity-weighted probability model uses CRM stage data along with buyer engagement signals, which include emails sent and replied to, meetings held, and call outcomes. It produces deal-level win probabilities that update in real time. The calculation shifts from pipeline multiplied by a historical rate to pipeline multiplied by a dynamic probability informed by buyer behavior. Some teams object that conversation signals introduce subjectivity. Yet ignoring those signals in favor of static probabilities preserves systematic optimism bias.
What blending multiple methods adds — and the conflict it creates at the sales-finance interface
Blending two or three methods can improve accuracy when their inputs are clean and reconciled. Pipeline-stage, historical, and rep-judgment methods offer different views of how much revenue to expect, and no one method can be trusted across every deal type and market condition. Reconciliation is the essential step. Without it, several estimates remain several estimates, rather than a forecast whose differences have been explained. Methodological variety is useful only when the underlying assumptions can be compared.
That requirement becomes especially important at the sales-finance interface. ZoomInfo’s guide describes agreement on growth targets and budget allocations as “structurally impossible” when the functions use different assumptions. It calls closed-loop visibility “the prerequisite for any planning process that holds up under scrutiny”. Resolving this requires data governance. Sales and finance cannot resolve a difference in their underlying numbers merely by applying more calculations to them.
The practical resolution is to blend methods only after establishing a single source of truth for pipeline data. Both functions can then check their estimates against the same records and spell out where their assumptions differ. Otherwise, blending multiplies errors in the underlying data. Teams may disagree over whether a buyer is ready or because their close dates are stale or their pipeline totals do not match. Formula architecture is secondary to whether sales and finance are working from the same numbers.
What AI forecasting tools actually fix — and the data threshold they require to work
AI forecasting tools can outperform human judgment and static formulas when CRM data completeness is high. With incomplete inputs, however, they can produce less reliable results than a simple stage-weighted calculation. The threshold is therefore foundational rather than a promise that a more complex model will compensate for missing evidence.
The Clari-Salesloft merger in December 2025 illustrates a structural response to this problem. Combining sequencing engagement data with forecast roll-up in one platform addresses the gap between sales execution and the evidence used to predict revenue. The value lies in connecting those inputs. Clari also publishes high forecast accuracy by week two of the quarter for SentinelOne and attributes the result to its AI-powered insights. That outcome does not remove the requirement for complete data, or establish model sophistication as the sole explanation.
The definition of completeness also depends on the revenue motion. Product-led and self-serve conversions may never enter a traditional opportunity pipeline, leaving pipeline-based formulas structurally incomplete for hybrid GTM motions. AI tools that ingest non-CRM signals are better positioned to handle those paths, but only when the data architecture captures the relevant signals in the first place.
Teams should build the formula layer by layer, then systematically address the data it consumes. That means selecting a structure suited to the sales motion, accounting for slippage and indecision, and testing the result against credible pipeline coverage. Teams must then keep fields accurate and make sure they capture all activity and buyer evidence. AI accelerates this work but does not replace it.