
Pipeline Generation Benchmarks for B2B Sales Teams by Role
Role-specific metrics reveal what blended benchmarks hide about pipeline generation.
Pipeline generation benchmarks tell you almost nothing unless you know which role, which segment, and which denominator produced them. A "47% win rate" and a 19% win rate can both be true statements about the same sales org, and boards get misled every quarter because nobody asks which one they're looking at.
Some win rate figures measure proposals issued and run close to 50%, while Ebsta and Pavilion's 2025 GTM Benchmarks report, built on 655,000 opportunities, measures win rate against every opportunity created, producing the confusion between the two figures. Some win rate figures measure proposals issued and run close to 50%. Ebsta and Pavilion's 2025 GTM Benchmarks report, built on 655,000 opportunities, measures win rate against every opportunity created, and that number came in at 19% for 2025. Both figures come from measuring different denominators, and swapping one for the other changes the apparent result dramatically. Neither is wrong. But swap one for the other in a board deck and someone walks away thinking the sales team either closes half of what it touches or barely one in five, and those are two entirely different businesses to run.
2026 makes this worse, not better. Ebsta and Pavilion clocked 78% of B2B sellers missing quota in 2025, a historic low that makes any target borrowed from a prior year close to useless as a baseline. Average deal value in that same dataset rose 54% year over year, meaning bigger checks, more scrutiny, more people in the room, and more ways for a deal to stall. Forrester's 2026 research puts the average buying committee at 13 internal stakeholders and 9 external ones per decision, a structural shift that touches every stage of every role's funnel differently, from the SDR's first cold call to the AE's final signature chase.
This piece names the denominator for every number it cites, because that's the only way a benchmark is usable. By the end, SDRs, AEs, and marketers each get a benchmark set built for the way their role actually works, not a blended average pulled from three different funnels stitched together.
The macro conditions every role-level benchmark is now measured against
Ebsta and Pavilion data show the average B2B win rate fell to 19% in 2025, down from 29% the year before. That's not a closing-skills problem. Read it as a shift in the ground itself, and every benchmark in this article should be read against that shift rather than treated as evidence that reps got worse at selling.
Sales cycles stretched right alongside it. SMB deals, generally under $15,000 in annual contract value, now run 14 to 30 days. Mid-market deals, roughly $15,000 to $100,000, run 30 to 90 days. Enterprise deals, above $100,000, run 90 to 180-plus days. A study from Optifai, drawing on data across 939 B2B SaaS companies, found cycles have lengthened 22% since 2022, tracking almost exactly with committee growth from an average of 5.4 stakeholders to 6.8.
Coverage ratios haven't caught up. The old rule of thumb, 3 to 4x pipeline coverage, assumes a win rate that no longer exists for most teams. Outreach and Forecastio data from 2025 and 2026 puts enterprise IT coverage needs at 3 to 5x, mid-market at 2.5 to 4x, and SMB at 2 to 3x. A team running a 19% win rate needs to work that math itself rather than inherit a ratio built for a 29% or 30% environment. The gap between the old rule and the current one isn't rounding error, it's the difference between a forecast that holds and one that collapses in Q4.
A pre-funnel shift is driving this that most pipeline dashboards don't see at all. The Answer Economy's B2B Buyer Behavior Report, surveying 1,076 buyers, found 51% now start research in an AI chatbot instead of a search engine. Callbox's 2026 roundup, citing 6sense-adjacent research, notes that 95% of deals go to a vendor already on the buyer's initial shortlist. Put those together and a benchmark measured only from the first form fill or first outbound touch is capturing the tail end of a decision that's already mostly made.
One more piece of context belongs here before any role gets its own numbers: expansion revenue. Ebsta and Pavilion found that customer expansion accounted for 52% of new revenue in 2025. That means pipeline benchmarks for account managers and quota-carrying CSMs look structurally different from net-new SDR and AE targets, and blending them into one "pipeline generation" number hides more than it reveals.
None of this is a motivation problem. It's a measurement problem, and the fix is measuring accurately by role, not setting harder targets on definitions that no longer describe the funnel.
SDR and BDR benchmarks: pipeline creation, activity rates, and meeting quality
Meetings booked is a vanity metric on its own. The number that actually matters for an SDR or BDR is pipeline created in dollars per month, because a meeting that never becomes a qualified opportunity did nothing for revenue, no matter how it looks on an activity dashboard.
Activity numbers still matter for diagnosing where a rep's process breaks down, just not as the target itself. Typical SDR daily output spans a mix of calls, emails, voicemails, and social touches across multiple channels. Most teams run high daily dial volumes, and connecting with a single prospect typically requires multiple attempts. Those figures describe effort, not outcome, and the gap between them is the whole point: high activity volume routinely produces low output, which is exactly why activity counts make a poor target and a decent diagnostic.
The real quality gate is meeting-to-opportunity conversion. Anything above 35% suggests SDRs are booking meetings that actually deserve to exist and that AEs can move forward. Fall below that line and the problem is either ICP drift (SDRs chasing accounts that were never going to buy) or a broken handoff between SDR and AE. Either way, it's a diagnosis, not a punishment.
Account penetration matters just as much, and it's the metric most teams under-track. Enterprise accounts need multiple engaged contacts, and mid-market accounts require more than a single thread. Single-threaded outreach in a world where the average buying committee runs 13 internal stakeholders produces single-threaded deals, and single-threaded deals die quietly in committee review, usually without anyone on the sales side ever finding out why.
Time-to-first-meeting shortens when outreach is triggered by an actual buying signal rather than a cold list, and that difference is directionally consistent even though the exact day count varies. Signal-based outreach, meaning outbound triggered by an actual buying signal rather than a cold list, consistently gets to a qualified meeting faster than untargeted prospecting. The exact day count varies too much by industry to state as one figure, but the direction holds across the data.
Available benchmark data puts quota attainment for SDRs and BDRs at a median of 45% to 60%, with top-quartile reps running 20 to 30 points above that range inside their segment. Research consistently finds sales reps spend a minority of their week on activities that actually generate revenue, with administrative work eating the rest, which explains a lot of the gap. For an SDR putting in only a couple of active selling hours a day, adding more activity targets on top of a broken stack just adds noise. The fix is fewer, better-targeted touches, not more volume.
SDR managers should run pipeline-dollar creation as the primary KPI, use meeting-to-opp rate to audit whether the ICP is actually being followed, and treat activity data as a diagnostic tool for execution gaps, never as a target in its own right.
AE benchmarks: stage conversion, win rates, and the committee problem
Before setting a single AE win rate target, settle the denominator. "Win rate" measured against all opportunities created is a different metric from win rate measured against proposals issued, and confusing the two is how a sales org convinces itself it's healthier than it is.
Using the all-opportunity denominator, SMB-focused teams run 30% to 40% win rates, with elite performers clearing 45%. Mid-market teams, generally 100 to 999 employees, run 25% to 35%, with top performers above 40%. Enterprise teams, 1,000-plus employees, run 20% to 25%, with the best teams reaching 30%. The overall B2B average sat at 19% in 2025. A team below its segment median has a stage-leakage problem to diagnose, not a quota to lower.
The handoff from SDR to AE deserves its own scrutiny. Gradient Works' 2025 benchmark compilation found that organizations with aligned lead definitions and shared CRM dashboards convert 30%-plus of MQLs to SQLs, while siloed organizations average closer to 13%. That's not a small gap, and it means SDR quality control isn't just an SDR problem, it directly governs how good the AE's pipeline is on arrival.
The committee, despite its reputation, isn't purely a drag on deal velocity. Forrester's research found that among buyer groups of six or more people, 94% report clear benefits from the larger group: broader perspective, an easier time securing budget, and a higher chance of internal approval once a decision gets made. An AE who maps the full stakeholder list early can use that structure to build internal momentum, rather than just surviving it stage by stage.
Two levers appear consistently in the Ebsta and Pavilion 2025 data. Deals that stall or get delayed lose win rate, measurably and directionally, though the exact percentage isn't worth guessing at here. Deals where a decision-maker gets involved early see a real lift in win rate. Both point to the same operational takeaway: AEs should be fighting for early access to the actual budget-holder, not settling for a champion who has to relay everything secondhand.
RepVue and Bridge Group data put AE quota attainment at a median of 40% to 55%, with top-quartile reps 20 to 30 points ahead. Enterprise AEs specifically sit closer to 38% to 45%, a number that leadership teams routinely underestimate when they build next year's quota off last year's plan.
Coaching is a real multiplier here. Structured coaching is consistently associated with meaningfully higher rates of quota attainment across benchmark data. Coaching quality belongs in the benchmark conversation itself, not as a separate management topic bolted on afterward.
Marketing benchmarks: sourced pipeline, funnel conversion, and channel contribution
Martal Group's 2026 data shows strong marketing programs contribute 25% to 30% of total pipeline in established markets, and up to 40% in new or emerging segments. A team consistently under 30% in an established market has a targeting or qualification problem sitting upstream, not an execution problem sitting in the campaigns themselves.
Funnel conversion by stage tells a specific story. Lead-to-MQL conversion averages around 31% in B2B, as First Page Sage found and as widely echoed across 2025 to 2026 benchmark roundups, so a meaningful share of leads never clear the first qualification gate at all. MQL-to-SQL fell from 13.1% in 2024 to 9.8% in 2026, per Forrester and Demand Gen Report data cited in Callbox's roundup, and it is the number that should worry marketing leaders most. The likely driver is definitional drift, meaning MQL criteria have loosened faster than sales' patience for bad leads, not that leads themselves got worse.
Programs that add behavioral or intent signals on top of basic firmographic MQL criteria report meaningfully better MQL-to-SQL conversion. The exact lift varies by program, but the direction is consistent enough to act on.
Channel performance splits in a way that should shape budget, not just messaging. Traffic referred from AI search tools tends to convert at a higher rate than traditional organic search, largely because the AI tool has already done some pre-qualifying before the click ever happens. Channel conversion performance varies meaningfully, and the mix that reaches a buyer who has already done AI-assisted research differs from what pipelines built on traditional search and paid channels assumed. That's a pipeline decision hiding inside what looks like an awareness-channel decision.
The pre-funnel accountability gap is the uncomfortable one. Forrester data via HubSpot, cited in Callbox's report, found 68% of B2B buyers already have a front-runner picked before their first direct interaction with any vendor. A marketing benchmark that only measures activity after a form fill is measuring the tail end of a decision that mostly already happened somewhere else.
ABM is a real multiplier in this environment. Martal Group's 2026 data found companies using account-based marketing are substantially more likely to hit their revenue goals, directionally significant enough to matter even without pinning an exact lift to it.
A meaningful share of marketers report ongoing pressure to deliver MQL volume regardless of quality, which is a quieter problem behind the falling MQL-to-SQL numbers. That pressure is a primary driver of wasted pipeline spend, and it explains why lead volume keeps climbing even as the rate of leads turning into real opportunities keeps falling.
How quota attainment benchmarks differ by segment and why averages obscure the real gap
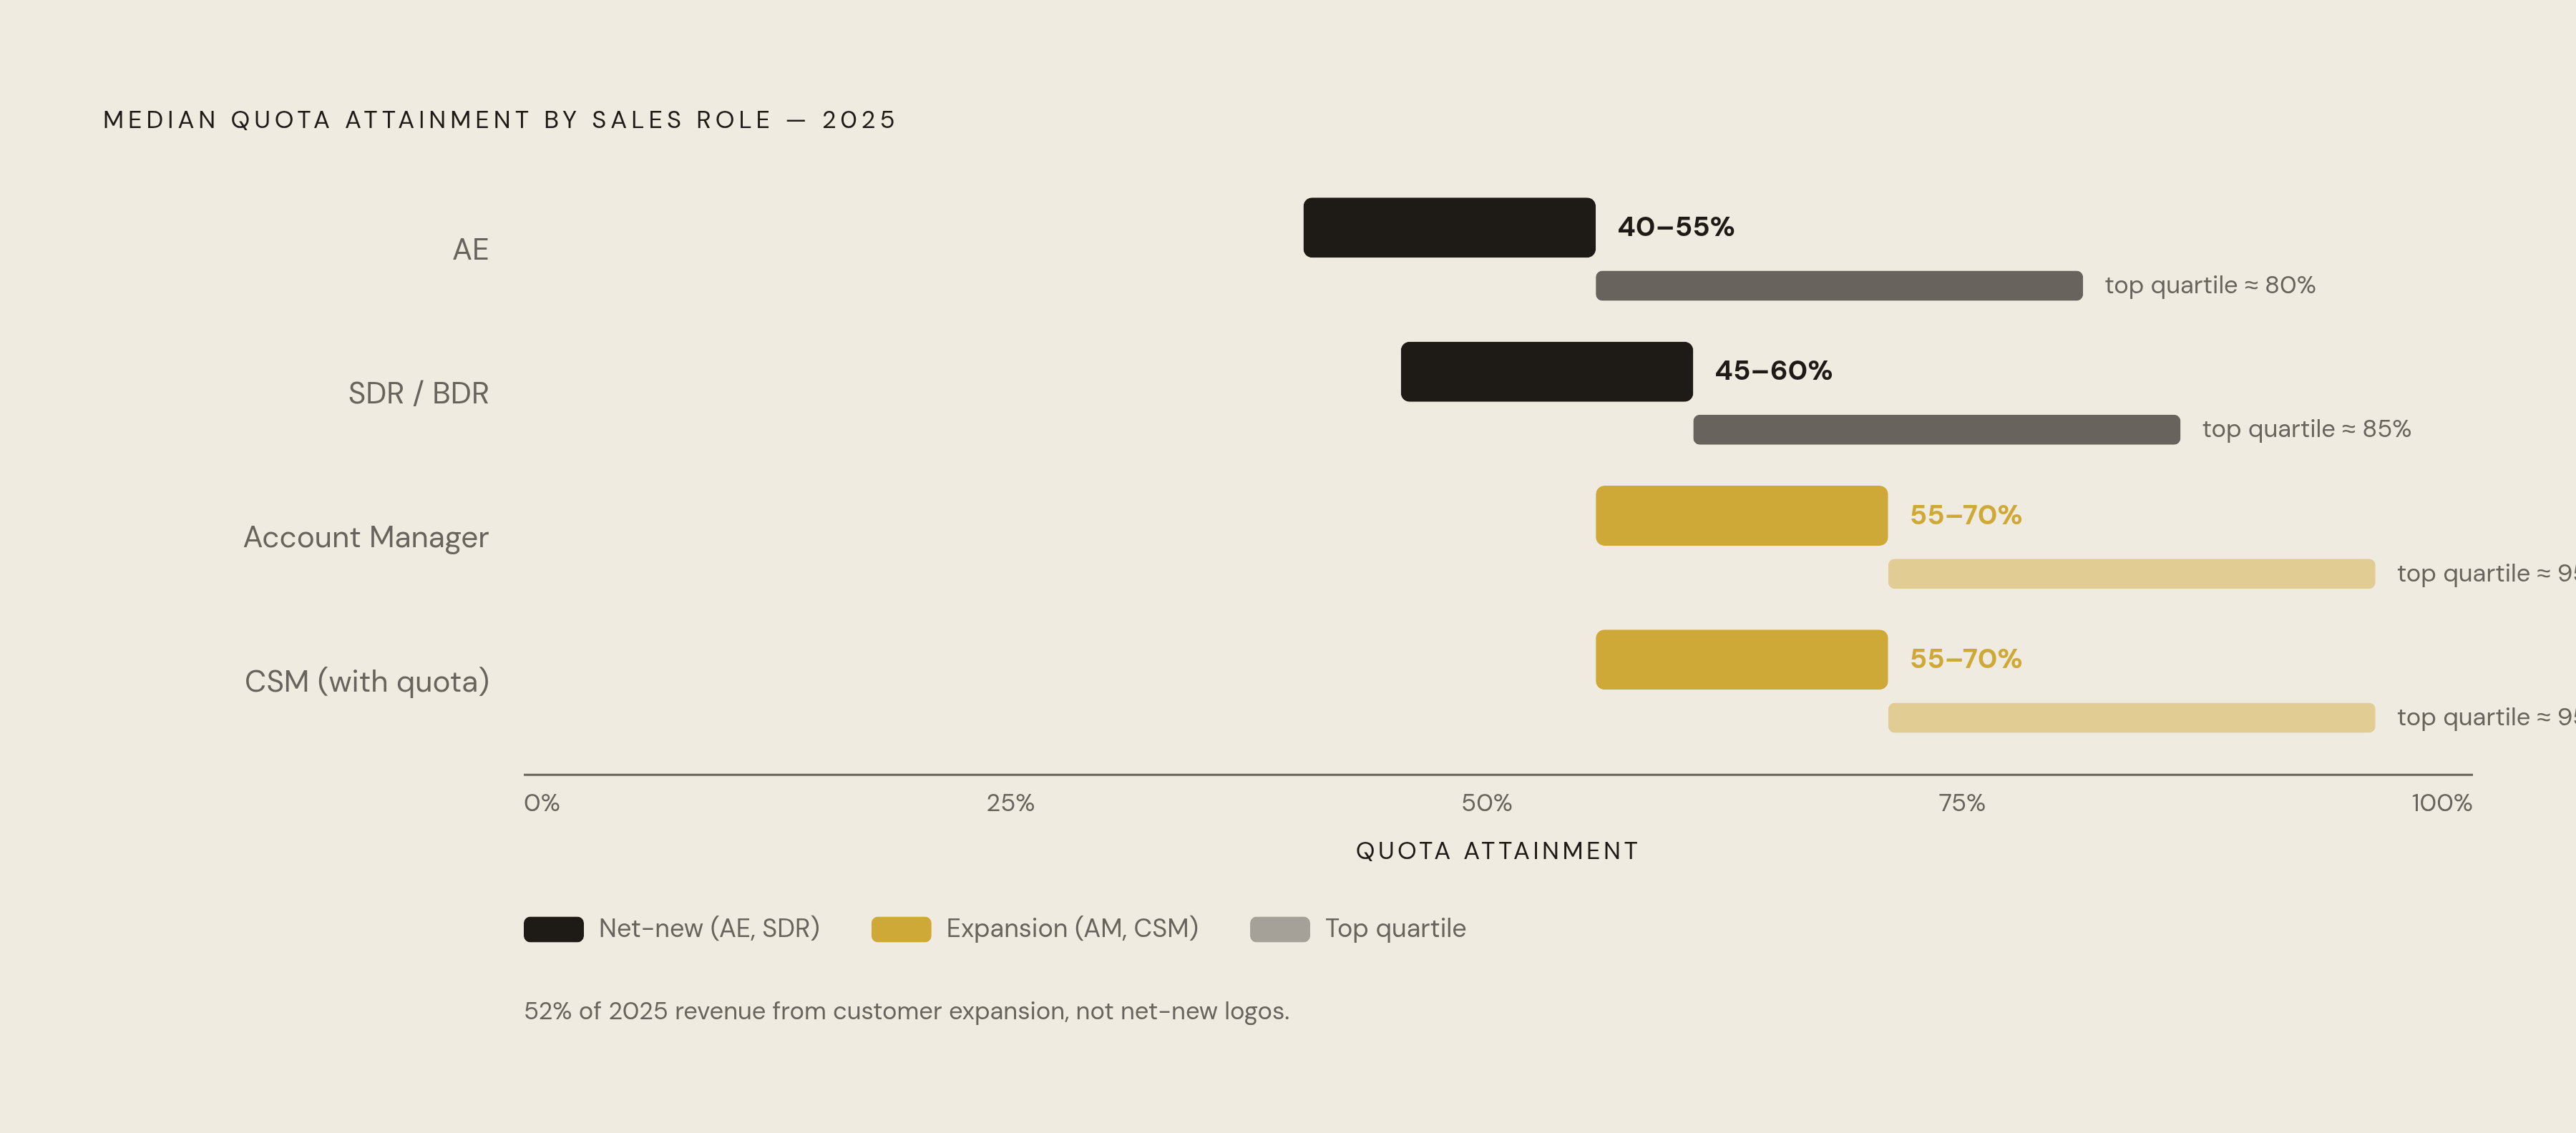
Attainment splits cleanly by segment, and blending them into one company-wide number is where most annual planning goes wrong. SMB SaaS teams run 50% to 58% attainment. Mid-market runs 43% to 52%. Enterprise runs 38% to 45%. In every band, top-quartile reps sit 20 to 30 points above the segment range, which by itself should disqualify median attainment as a target-setting number.
Here's the deeper issue. Ebsta and Pavilion's 2025 data shows a small share of sellers now drives the large majority of total revenue. That's not a normal distribution with some noise around the mean, it's a bimodal one, and a team-wide attainment average papers over both ends: the benchmark set to the mean underserves the reps actually carrying the number, and overstates what the middle of the roster will realistically produce.
Conversion speed shows the same pattern. Top performers close deals dramatically faster than bottom performers in the same role and segment, and that gap widened year over year in the 2025 Ebsta and Pavilion data. Setting one velocity benchmark for an entire team flattens a difference that's actually the most useful signal a sales leader has.
Attainment across roles tells its own story about where revenue is really coming from. AE median is 40% to 55%. SDR/BDR median runs 45% to 60%. Account manager median runs 55% to 70%. CSM-with-quota median also runs 55% to 70%. Those last two numbers aren't a coincidence: they track directly with the 52% of new 2025 revenue that Ebsta and Pavilion say came from customer expansion rather than net-new logos. Expansion roles are, in this environment, both more productive per rep and more stable quota contributors than net-new roles.
Setting one blended quota across a mixed-segment team will undershoot what enterprise reps need and overshoot what SMB reps can realistically hit. Segment-specific targets aren't a nice-to-have layer of precision. They're the baseline requirement for a quota that means anything.
Where AI moves the benchmark needle, and where it does not
Adoption and impact are two different questions, and most of the conversation about applying this technology to sales collapses them into one. Deloitte's study, covering roughly 1,060 B2B suppliers and buyers, found a substantial share of suppliers use AI somewhere in the sales process, but a much smaller share have deployed anything genuinely agentic or autonomous. Most teams reporting "AI-driven" results are running assisted workflows, tools that draft an email or summarize a call, not systems making independent decisions about who to contact or when.
That distinction matters for benchmarks specifically. An assisted workflow can plausibly move activity-level numbers, cutting down the time an SDR spends writing a first-touch email, tightening a call summary, flagging a stalled deal for a manager to look at. Those gains cut down the time an SDR spends writing a first-touch email, tightening a call summary, or flagging a stalled deal for a manager to look at, which ties directly back to the McKinsey finding that reps only spend 28% to 30% of their week on revenue-generating work in the first place.
What agentic AI would need to do, and what most deployments haven't yet reached, is change the structural numbers: win rate, cycle length, coverage ratio. Those are shaped by buyer behavior, committee size, and deal complexity, forces that a faster email draft doesn't touch. Until autonomous AI adoption catches up to assisted adoption, the honest read is that AI is currently a tool for reclaiming rep time, not a lever that rewrites the benchmarks laid out above. Any benchmark claiming otherwise deserves the same scrutiny as a win rate with no stated denominator: ask what's actually being measured before believing the number.
Sources
- Lead Generation Statistics 2026: 80+ B2B Benchmarks That Drive Pipeline
- B2B Pipeline Conversion Rate Benchmarks 2026
- Why B2B Pipeline Generation Is Changing Sales in 2026
- Pipeline Generation: What It Is and How to Do It in 2026
- 2025 B2B sales performance benchmarks
- Lead Generation Statistics 2026: Benchmarks & Trends
- B2B SaaS pipeline benchmarks 2026 | Grou
- B2B Sales Benchmarks 2026: Win Rates, Quota & Cycles